Evaluation of the impact of Covid-19 restrictions on the levels of air pollution in Germany
In December 2019, a novel coronavirus strain (SARS-CoV-2) was identified from an outbreak in Wuhan China, generating a pandemic that has caused more than 543 million cases and 6.32 million confirmed deaths, making it one of the deadliest in history.
In order to mitigate the negative impacts of Covid-19, the German government implemented a series of restrictions and lockdowns that aimed to minimize the spread of the virus and decrease the incidence rate in the country.
In this geospatial analysis, we are going to have a look at the changes experienced during the peak of the restrictions in terms of air pollution contained in the atmosphere and the impact that day-to-day activities like commuting to the office and international traveling have on the quality of the air that we breathe.
Data Sources
For this analysis, I needed datasets that provided information about the quality of air within the German territory and also geographic data of the administrative subdivisions of Germany that could help me generate information by states and districts. Such information was obtained from:
- Copernicus: the European Union's Earth observation programme that provides consistent and quality-controlled information related to air pollution and health - https://www.copernicus.eu/
- DIVA-GIS: website that contains free spatial data and resources - https://www.diva-gis.org/
- The European Environment Agency: is an agency of the European Union, whose task is to provide sound, independent information on the environment - https://www.eea.europa.eu/
PM10 as Air pollutant
PM10 is an air pollutant consisting of small particles with an aerodynamic diameter less than or equal to a nominal 10 micrometer (about 1/7 the diameter of a single human hair). Their small size allows them to make their way to the air passages deep within the lungs where they may be deposited and result in adverse health effects. PM10 also causes visibility reduction.
Methodology
After the creation of python scripts for the download, filtering,
and processing of the datasets, I proceeded to make use of spatial
interpolations for estimating the spatial distribution of PM10
based on the data provided by the air monitoring stations in
Germany.
As I wanted the information to be categorized by district, I also
made use of zonal statistics to group the raster information based
on the vector geometries of the administrative boundaries of
Germany.
Finally, with the help of raster calculations, I obtained the
relative changes in the concentration of PM10 particles between
April 2019 and April 2020.
Results
In the maps below I show the results of this spatial analysis begining by the average PM10 concentration by district and followed by the relative changed experience during this period.
PM10 Concentration April 2019
PM10 Concentration April 2020
Minimum and Maximum average concentration in Germany for April 2019-2020
| Min PM10 Concentration | Max PM10 Concentration | Germany's PM10 average concentration | |
|---|---|---|---|
| April 2019 | 8,503 μg/m3 | 35,693 μg/m3 | 21,879 μg/m3 |
| April 2020 | 10,241 μg/m3 | 29,666 μg/m3 | 19,842 μg/m3 |
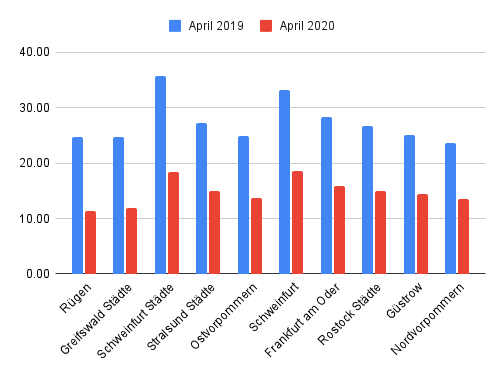
Top reductions of PM10 by district
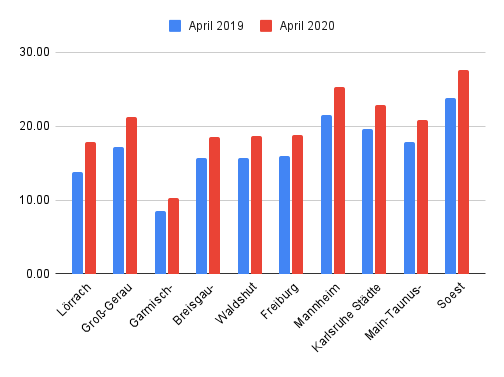
Top increments of PM10 by district
Relative Change April 2019 - April 2020
Bonus Map - Location of coal mines in Germany
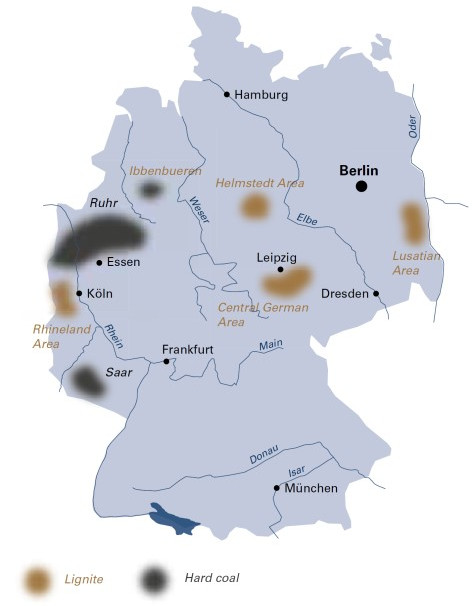
Source: European Association for Coal and Lignite
Conclusion
Based on the data obtained, we can observe a relative improvement
of about 9,31% in the air quality of Germany during the peak of
the covid-19 restrictions compared to the previous year. The
districts belonging to the state of Mecklenburg-Vorpommern,
located along the Baltic Sea coast, experienced the most
improvement of the country, making some districts account for a
relative 50% reduction of PM10 concentration. An interesting
observation though is that in some districts the pollution levels
increased up to 20% despite the restrictions.
It's important to note that PM10 concentrations may also vary due
to natural and meteorological events and every change can't be
categorized as a consequence of human activities. In future
spatial analysis I will be comparing NO2 concentrations
during lockdowns, which is a chemical compound known to be mainly
produced during the combustion of fossil fuels.
For now, the pandemic seems to be entering a different phase, only
time will tell if any change in the concentration of PM10 will be
reverted as we resume the routines we used to have in pre-covid
times.
References
- PM10 European Environment Agency - https://www.eea.europa.eu/themes/air/air-quality/resources/glossary/pm10
- COVID-19 pandemic - https://en.wikipedia.org/wiki/COVID-19_pandemic
- Power sources in Germany - https://www.carbonbrief.org/how-germany-generates-its-electricity/